
Reveal's "redlining" analysis is an example of how not to do data science
I got a text message from my best friend Jeff around 4pm, yesterday and I honestly though he wanted to record some more episodes for our new phone conversation podcast.
He said to call me.
I called him back.
He talked about an episode of a popular podcast he likes to listen to called “Reval” with the titled episode: The red line: Racial disparities in lending. He talked about how they identified and outlined a racial disparity between loan application approvals between non-Hispanic whites and minorities. Jeff talked to me about how the reporters utilized a logistic regression model that left out significant variables that would significantly agument the magnitude of effects seen from each variable. I was shocked that a podcast sponsored by PRX (Public Radio Exchange, one fo the largest on-demand catalog of public radio programs available), would let an article like this go to print, so I was apprehensive at first. However, the more I listened to him, the more I was convinced. In fact, so convinced that I followed the link Jeff provided me, found the white paper, and tried to make sense what the reporters did.
This post will highlight what the Reveal reporters did, the main things wrong with this analysis, possible routes of action the Reveal can take, and recorded attempts to get in contact with the authors to discuss my findings.
What Reveal did
This section will detail the main analysis of the Reveal reporters mainly though their published white paper, posted on their site, along with a google drive link to regression results and data dictionaries (See below).
https://drive.google.com/drive/folders/1b1_Zod1y5rwq0GVh1d7pdssCx92X6rQP
I have provided the link to the white paper below:
https://www.revealnews.org/article/how-we-identified-lending-disparities-in-federal-mortgage-data/
https://s3-us-west-2.amazonaws.com/revealnews.org/uploads/lending_disparities_whitepaper_180214.pdf
lending_disparities_whitepaper_180214
The paper was split into three main analyses, however for my post, I will be talking about the main regression analysis, mentioned primarily in the paper.
The reveal white paper states:
To evaluate whether disparities in lending exist, we used a statistical technique called a binary logistic regression. This type of regression assesses the relationship between multiple independent variables against a single binary output, whether a specific event occurred or not. In this case, we looked at whether a mortgage was denied.
So with the dependent variable being loan application denial, the reporters created a regression model investigating what variables significantly affect the risk of loan denial.
To quote the paper, the Reval reporters:
...analyzed data from 2015 and 2016, looking at nine independent variables to predict loans that were denied. Those factors were:
- Race/Ethnicity
- Native American
- Asian
- Black
- Native Hawaiian
- Hispanic/Latino
- Race and ethnicity were not reported
- Sex
- Whether there was a co-applicant
- Applicant’s annual income (includes co-applicant income)
- Loan amount
- Ratio between the loan amount and the applicant’s income
- Ratio between the median income of the census tract and the median income of the metro area
- Racial and ethnic breakdown by percentage for each census tract
- Regulating agency of the lending institution
The reporters only included metro areas for analysis based on the follwoing criteria
- Pseudo R-Square is greater than or equal to 0.1.
- P-value for applicants of color is less than or equal to 0.05.
- The odds multiplier for each variable is greater than or equal to 1.5.
- Each racial and ethnic group had to have 75 or more applicants.
- The metros had to individually meet these cutoffs for home purchase loans in both 2015 and 2016 to establish that the result was not anomalous. In our stories, we use numbers from 2016 to show the most recent data.
This analysis has caught the attention of major news outlets including NPR subsidiaries in Philadelphia and other cities.
I will include the links to the ones I found:
https://www.democracynow.org/2018/2/27/modern_day_redlining_banks_face_probes
http://michiganradio.org/post/data-analysis-modern-day-redlining-happening-detroit-and-lansing
https://jezebel.com/report-people-of-color-significantly-less-likely-to-re-1823059961
https://www.marketplace.org/2018/02/15/world/barriers-homeownership-still-exist-people-color
http://wunc.org/post/blacks-and-latinos-denied-mortgages-rates-double-whites#stream/0
No Credit Score, No Dice
So the first thing Jeff and I talked about and opened the Pandora’s box of analysis, was the fact that credit scores were not included in the analysis. I talked about the fact that maybe they included a debt-income ratio as a possible proxy. He said no.
The Reveal reporters in their paper stated that:
Credit scores carry their own set of problems. Studies have cited a relationship between lower credit scores and borrowers of color. The credit score doesn’t reflect on-time rent or utility bill payments, only those that are delinquent, which disproportionately affects people of color who may have less access to other types of credit, such as mortgages and credit cards. Lenders have also pointed out that an applicant's total debt-to-income ratio weighs heavily in lending decisions. That data point isn’t currently available in the data set either
Controlling variables that researcher know will affect the other variables in the model, as a whole, SHOULD NOT and CANNOT be excluded. For a multitude of reasons(1,2), the primary reason for loan approval IS credit worthiness, primarily dependent on credit scores (https://www.inc.com/encyclopedia/credit-evaluation-and-approval.html ). For the authors to leave out or explain away credit score, risks total model invalidation by failing to account for mediating factors affecting odds ratios of the independent variables.
Without an appropriate proxy for credit score, the reporters will not be able to determine if the race variables are actually account for any of the variance found in the 2015-16 data.
From this alone, we can assume that results found in the analysis are not legitimate and not be used for any type of large-scale analysis.
Missing Data and other issues
My phone conversation with Jeff lasted for almost an hour, going over the white paper and ancillary data determining that the initial loan rejection model is illegitimate due to the lack of credit score data.
Additionally, I uncovered in their published analysis results and found something I found to be staggering:
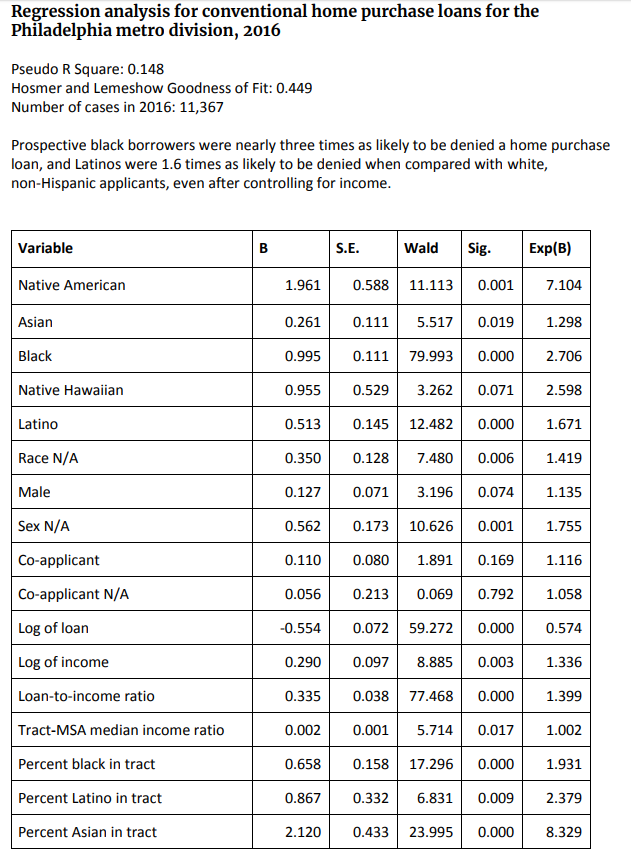
Reference variables ● White non-Hispanic applicants ● Female applicants ● Federal Deposit Insurance Corporation (FDIC)
Notice that there are NA values present in the regression results, concluding that reporters including NAs in the regression data set. At first I though the NA values were the reference variables, however this does not make sense due to the non-1.00 Odds Ratio. This for a logistic regression (or any type of regression) is unacceptable and dramatically skews the way the variables interact with each other. The standard operating procedure is to either exclude the data or use an imputation method (3) to “guess” the race or gender. To leave the NA values intact tells the reader or listener that the reporters DID NOT clean the overall dataset or assume that the NA values act as one. Both unacceptable for a large-scale analysis to predict rejection risk.
Additionally they are other issues and inconsistencies:
- The full regression analyses from all 61 metro areas, for 2015-16, are not available
- The full data set for the regression analysis is not present
- The Hosmer and Lemeshow Goodness of Fit for the Phildelphia 2015 model was 0.002, which indicates poor model fit
- NO model validation
My communication with Reveal and possbile courses of action
In order to get some clarity, I have attempted gotten in contact with authors of this study and article (Aaron Glantz and Emmanuel Martinez).
I reccomend the analysis be redone to include variables representing credit score or at least a legitimate proxy.
As of 6:06pm on March 1st 2018, I have sent two emails and one tweet with one like from Aaron Glantz.
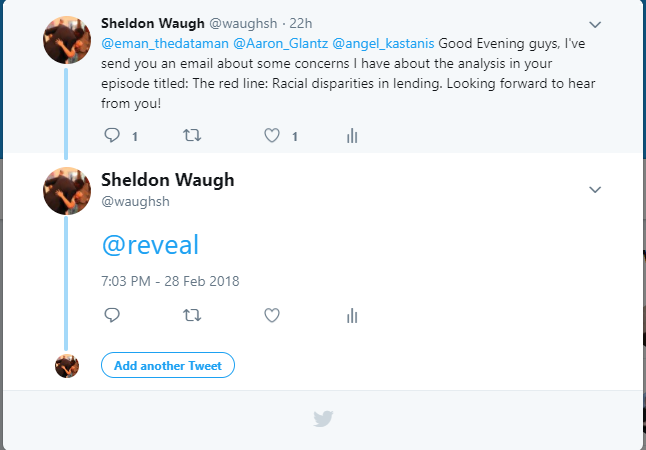
As of 8:13pm on March 2nd 2018, I have sent one additional email with tweets directed to all authors and staff of the Reveal Podcast and the Associated Press.
Hopefully with this post I will be able to get some answers to my questions!
I will be updating this with response, additional information, inconsistencies and other pertinent information!
March 3rd:
https://www.jdsupra.com/legalnews/modern-day-redlining-reveal-s-53548/
Rebuttals from the MBA about the analysis.
A response from Davis Stevens, president and CEO of the Mortgage Bankers Association, about how the analysis was flawed.
March 6th 2018:
Received an email from Emmanuel Martinez regarding the article. No incriminating text, but I am reluctant to release the email correspondence. We discussed the validity of data missing crucial values and imputation, and the overall validity of credit scores.
GO GATA.
References: